[vc_row remove_vertical_spacing=”yes”][vc_column][vc_column_text]Measuring our impact – CARE’s Global Indicators
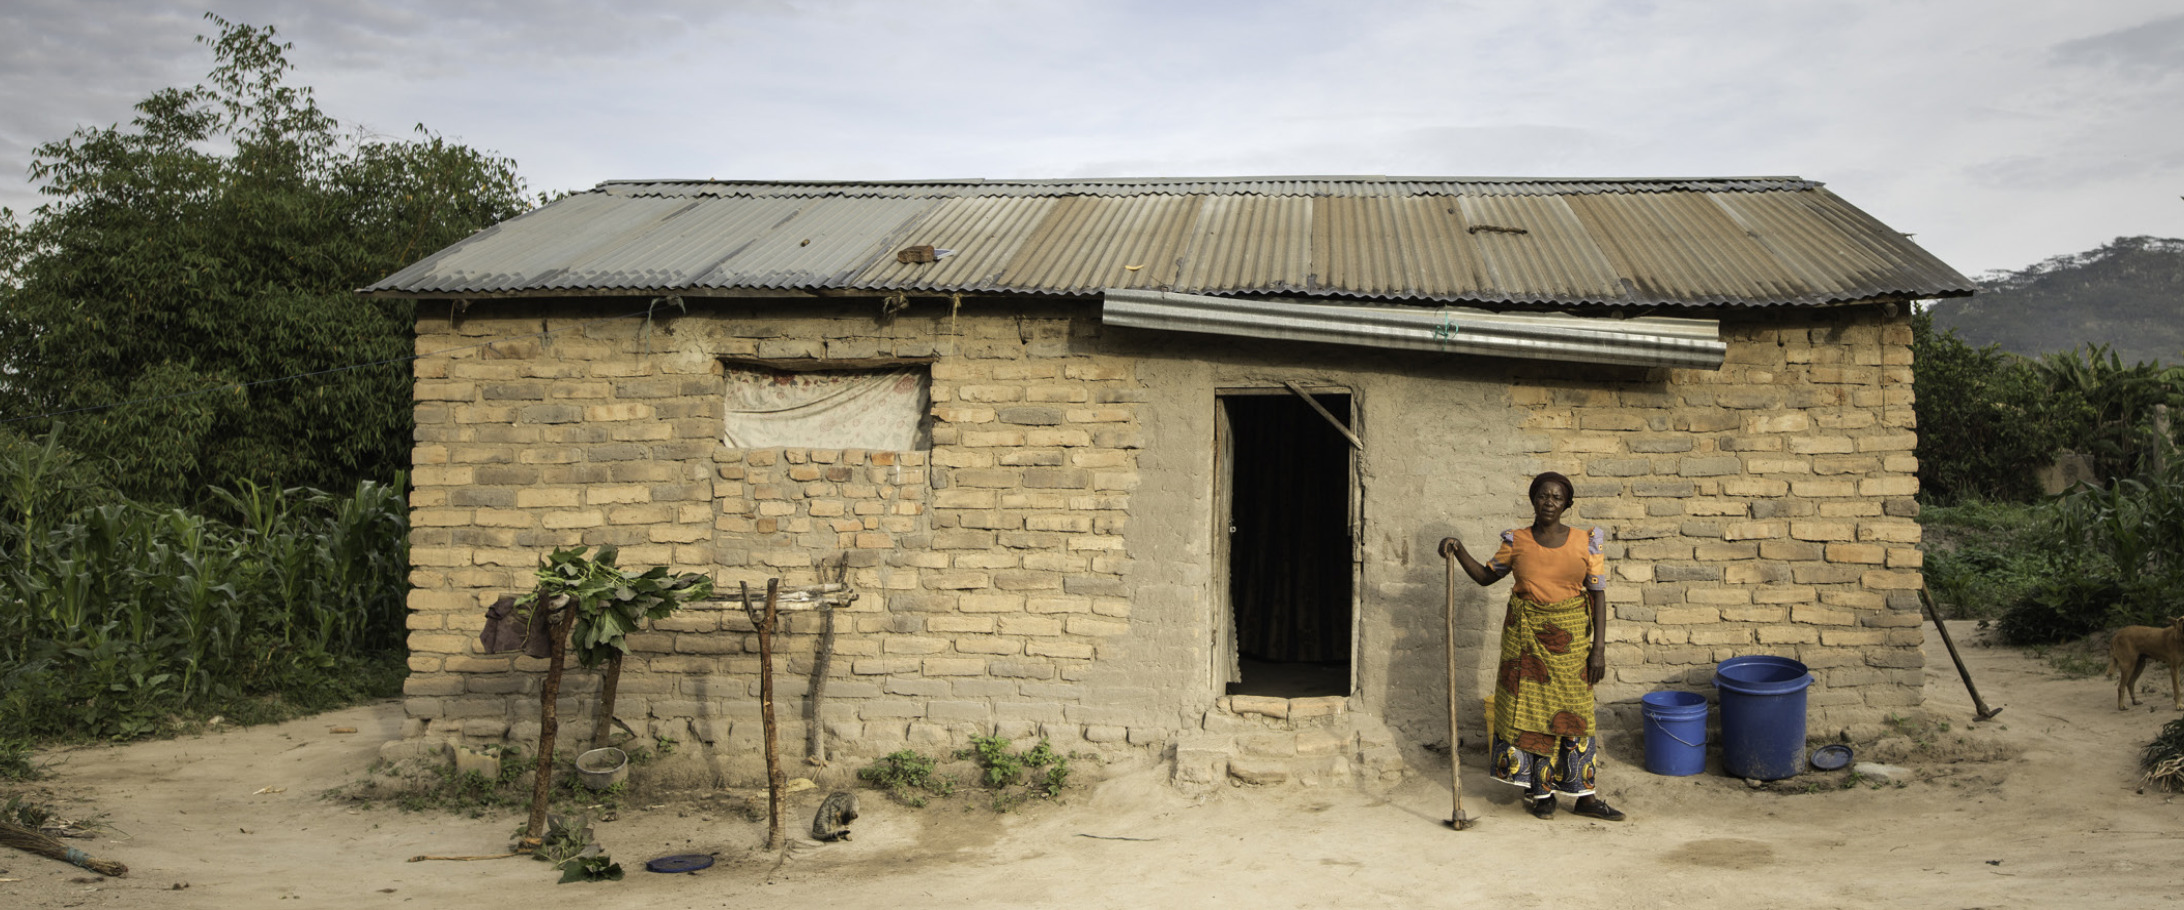
With almost 1,000 CARE projects in over 90 countries around the world, there is a lot of information about our work and our impact.
To help streamline our reporting and share information with our donors and the public, CARE has developed 25 Global Indicators to track our progress in key areas of our work.
They draw on CARE’s experience across different sectors – understanding of the kind of programs we do, the kind of tools we use and ways that we can feasibly measure progress.
They were also cross-referenced with the Sustainable Development Goals to make sure that we are measuring what others are measuring. This also helps us to talk about CARE’s contribution to global development efforts.
[/vc_column_text][/vc_column][/vc_row][vc_row remove_vertical_spacing=”yes”][vc_column][cq_vc_expandgrid gridnumber=”5″ avatarsize=”80″ labelfontsize=”15px” openfirst=”” nocircular=””][cq_vc_expandgrid_item avatartype=”image” avatarimage=”21545″ avatarresize=”yes” avatarimagesize=”300″ gridlabel=”Ending Global Poverty” bgstyle=”grapefruit” isresize=””]Ending Global Poverty
1. Proportion of the population below the international poverty line
 [/cq_vc_expandgrid_item][cq_vc_expandgrid_item avatartype=”image” avatarimage=”21547″ avatarresize=”yes” avatarimagesize=”300″ gridlabel=”Ending National Poverty” bgstyle=”mint” isresize=””]
Ending National Poverty
2. Proportion of the population below the national poverty line
 [/cq_vc_expandgrid_item][cq_vc_expandgrid_item avatartype=”image” avatarimage=”21548″ avatarresize=”yes” avatarimagesize=”300″ gridlabel=”Basic Services for All” bgstyle=”grass” isresize=””]
Basic Services for All
3. Proportion of the population living in households with access to basic services

[/cq_vc_expandgrid_item][cq_vc_expandgrid_item avatartype=”image” avatarimage=”21549″ avatarresize=”yes” avatarimagesize=”300″ gridlabel=”Meeting Needs During Crisis” bgstyle=”bittersweet” isresize=””]
Meeting Needs During Crisis
4. # and % of disaster/crisis-affected people supported through/by CARE who:
 obtained adequate emergency shelter and/or recovered adequate housing
- had access to safe drinking water and/or adequate sanitation facilities and/or used adequate hygiene practices
- obtained adequate food quantities and quality, and/or adopted adequate nutritional practices
- had access to at least one SRH service (especially women of reproductive age and adolescent girls)
- recovered household goods, assets, and/or income opportunities
[/cq_vc_expandgrid_item][cq_vc_expandgrid_item avatartype=”image” avatarimage=”21550″ avatarresize=”yes” avatarimagesize=”300″ gridlabel=”Satisfaction with CARE’s Response” isresize=””]Satisfaction with CARE’s Response
5. % of disaster/crisis affected people in areas of CARE responses who report satisfaction with regards to relevance, timeliness and accountability of humanitarian interventions
 [/cq_vc_expandgrid_item][cq_vc_expandgrid_item avatartype=”image” avatarimage=”21551″ avatarresize=”yes” avatarimagesize=”300″ gridlabel=”Women’s Reproductive Control” bgstyle=”lavender” isresize=””]
Women’s Reproductive Control
6. Demand satisfied for modern contraceptives among women aged 15-49
 [/cq_vc_expandgrid_item][cq_vc_expandgrid_item avatartype=”image” avatarimage=”21553″ avatarresize=”yes” avatarimagesize=”300″ gridlabel=”Skilled Assistance at Birth” bgstyle=”pinkrose” isresize=””]Skilled Assistance at Birth
7. Proportion of births attended by skilled health personnel
 [/cq_vc_expandgrid_item][cq_vc_expandgrid_item avatartype=”image” avatarimage=”21554″ avatarresize=”yes” avatarimagesize=”300″ gridlabel=”Protecting Adolescents from Parenthood” bgstyle=”grapefruit” isresize=””]Protecting Adolescents from Parenthood
8. Adolescent birth rate (disaggregated by 10-14; 15-19 years) per 1,000 women in each age group. Proxy indicator: Age at first delivery.
 [/cq_vc_expandgrid_item][cq_vc_expandgrid_item avatartype=”image” avatarimage=”21555″ avatarresize=”yes” avatarimagesize=”300″ gridlabel=”Women’s Self-Determined Sexuality” bgstyle=”lightgray” isresize=””]Women’s Self-Determined Sexuality
9. Proportion of women aged 15-49 who make their own informed decisions regarding sexual relations, contraceptive use and reproductive health care.
 [/cq_vc_expandgrid_item][cq_vc_expandgrid_item avatartype=”image” avatarimage=”21556″ avatarresize=”yes” avatarimagesize=”300″ gridlabel=”No Violence in the Home” bgstyle=”bluejeans” isresize=””]No Violence in the Home
10. % of people who reject intimate partner violence
 [/cq_vc_expandgrid_item][cq_vc_expandgrid_item avatartype=”image” avatarimage=”21558″ avatarresize=”yes” avatarimagesize=”300″ gridlabel=”Peaceful Relationships” bgstyle=”mediumgray” isresize=””]Peaceful Relationships
11.% of ever-partnered women and girls aged 15 years and older subjected to physical, sexual or psychological violence by a current or former intimate partner, in the last 12 months
 [/cq_vc_expandgrid_item][cq_vc_expandgrid_item avatartype=”image” avatarimage=”21559″ avatarresize=”yes” avatarimagesize=”300″ gridlabel=”Freedom from Sexual Violence” bgstyle=”grapefruit” isresize=””]Freedom from Sexual Violence
12.% of women and girls aged 15 years and older subjected to sexual violence by persons other than an intimate partner, in the last 12 months
 [/cq_vc_expandgrid_item][cq_vc_expandgrid_item avatartype=”image” avatarimage=”21560″ avatarresize=”yes” avatarimagesize=”300″ gridlabel=”Enough Food for Everyone” bgstyle=”bittersweet” isresize=””]Enough Food for Everyone
13. Prevalence of population with moderate or severe food insecurity, based on the Food Insecurity Experience Scale (FIES)  [/cq_vc_expandgrid_item][cq_vc_expandgrid_item avatartype=”image” avatarimage=”21561″ avatarresize=”yes” avatarimagesize=”300″ gridlabel=”Growing to Full Potential” bgstyle=”sunflower” isresize=””]Growing to Full Potential
14. Prevalence of stunting among girls and boys under the age of five
 [/cq_vc_expandgrid_item][cq_vc_expandgrid_item avatartype=”image” avatarimage=”21562″ avatarresize=”yes” avatarimagesize=”300″ gridlabel=”Strong in the Face of Climate Change” bgstyle=”lavender” isresize=””]Strong in the Face of Climate Change
15. Numbers of people better able to build resilience to the effects of climate change and variability
 [/cq_vc_expandgrid_item][cq_vc_expandgrid_item avatartype=”image” avatarimage=”21563″ avatarresize=”yes” avatarimagesize=”300″ gridlabel=”Women’s Access to Money” bgstyle=”mint” isresize=””]Women’s Access to Money
16. # and % of women who are active users of financial services (disaggregated by informal and formal services)

[/cq_vc_expandgrid_item][cq_vc_expandgrid_item avatartype=”image” avatarimage=”21564″ avatarresize=”yes” avatarimagesize=”300″ gridlabel=”Couples’ Shared Decision Making” isresize=””]Couples’ Shared Decision Making
17. % of women who (report they) are able to equally participate in household financial decision-making
[/cq_vc_expandgrid_item][cq_vc_expandgrid_item avatartype=”image” avatarimage=”21569″ avatarresize=”yes” avatarimagesize=”300″ gridlabel=”Dignified Work for All” bgstyle=”darkgray” isresize=””]Dignified Work for All
18. # and % of women with union, women’s group or cooperative membership through which they can voice their labor rights
 [/cq_vc_expandgrid_item][cq_vc_expandgrid_item avatartype=”image” avatarimage=”21572″ avatarresize=”yes” avatarimagesize=”300″ gridlabel=”People Steering Change” bgstyle=”grapefruit” isresize=””]People Steering Change
19. # and % of people of all genders who have meaningfully participated in formal (government-led) and informal (civil society-led, private sector-led) decision-making spaces

[/cq_vc_expandgrid_item][cq_vc_expandgrid_item avatartype=”image” avatarimage=”21576″ avatarresize=”yes” avatarimagesize=”300″ gridlabel=”Policies Responsive to People’s Right ” bgstyle=”bittersweet” isresize=””]Policies Responsive to People’s Right
20. # of new or amended policies, legislation, public programs, and/or budgets responsive to the rights, needs and demands of people of all genders
[/cq_vc_expandgrid_item][cq_vc_expandgrid_item avatartype=”image” avatarimage=”21577″ avatarresize=”yes” avatarimagesize=”300″ gridlabel=”Stronger in an Uncertain World” bgstyle=”pinkrose” isresize=””]Stronger in an Uncertain World
21. # and % of men, women, boys and girls that have actively engaged in reducing their vulnerabilities to the shocks and stresses that affect them.
 [/cq_vc_expandgrid_item][cq_vc_expandgrid_item avatartype=”image” avatarimage=”21636″ avatarresize=”yes” avatarimagesize=”300″ gridlabel=”Gender Equality in Emergencies” isresize=””]Gender Equality in Emergencies
22. # and % of CARE’s humanitarian initiatives complying with gender marker requirements
 [/cq_vc_expandgrid_item][cq_vc_expandgrid_item avatartype=”image” avatarimage=”21637″ avatarresize=”yes” avatarimagesize=”300″ gridlabel=”Innovating for Fighting Poverty” bgstyle=”grass” isresize=””]Innovating for Fighting Poverty
23. # and % of projects/programs that developed innovations for fighting poverty and inequality
 [/cq_vc_expandgrid_item][cq_vc_expandgrid_item avatartype=”image” avatarimage=”21637″ avatarresize=”yes” avatarimagesize=”300″ gridlabel=”Influencing Policy Change” bgstyle=”bittersweet” isresize=””]Influencing Policy Change
24. # and % of projects/programs that influenced policy change

[/cq_vc_expandgrid_item][cq_vc_expandgrid_item avatartype=”image” avatarimage=”21638″ avatarresize=”yes” avatarimagesize=”300″ gridlabel=”Unleashing What Works” bgstyle=”grapefruit” isresize=””]Unleashing What Works
25. # and % of projects/programs that linked or worked with strategic alliances and partners to take tested and effective solutions to scale
[/cq_vc_expandgrid_item][/cq_vc_expandgrid][/vc_column][/vc_row][vc_row][vc_column][/vc_column][/vc_row]